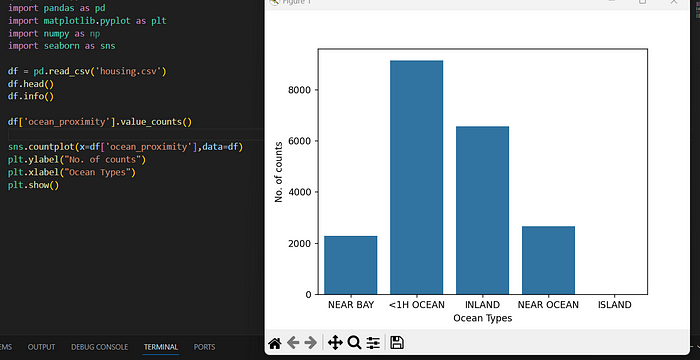
sns.countplot
sns.countplot(y=df[input_target_class] ,data=df),
utilizes Seaborn's countplot function to generate a visualization that depicts the frequency distribution of a categorical variable in your machine learning dataset. Here's a detailed breakdown:

Function:
sns.countplot: This function is imported from the Seaborn library and is specifically designed to create count plots, which are a type of bar chart that tallies the occurrences of each category within a categorical variable.
Arguments:
y=df[input_target_class]: This argument specifies the data to be visualized on the y-axis. Here, it extracts a column namedinput_target_classfrom the DataFramedf. This column is assumed to contain categorical data, such as class labels or groups.data=df: This argument indicates the DataFrame (df) that holds the data you're working with. Seaborn will use this DataFrame to create the count plot.
Output:
The code will generate a count plot where:
- The x-axis represents the unique categories present in the
input_target_classcolumn. - The y-axis displays the frequency (count) of each category. In other words, for each category on the x-axis, the corresponding bar on the y-axis indicates how many times that category appears in the
input_target_classcolumn.
Interpretation:
This count plot is instrumental in machine learning for understanding the class distribution or the balance between different categories in your target variable. An imbalanced dataset, where one class has significantly more instances than others, can lead to challenges in model training and evaluation. By visualizing the class distribution using sns.countplot, you can identify potential imbalances and take appropriate steps, such as data oversampling or undersampling, to address them before training your machine learning model.
In essence, this code snippet provides a quick and informative way to explore the class distribution within your machine learning dataset using Seaborn’s countplot function.
